Market Update – June 2021
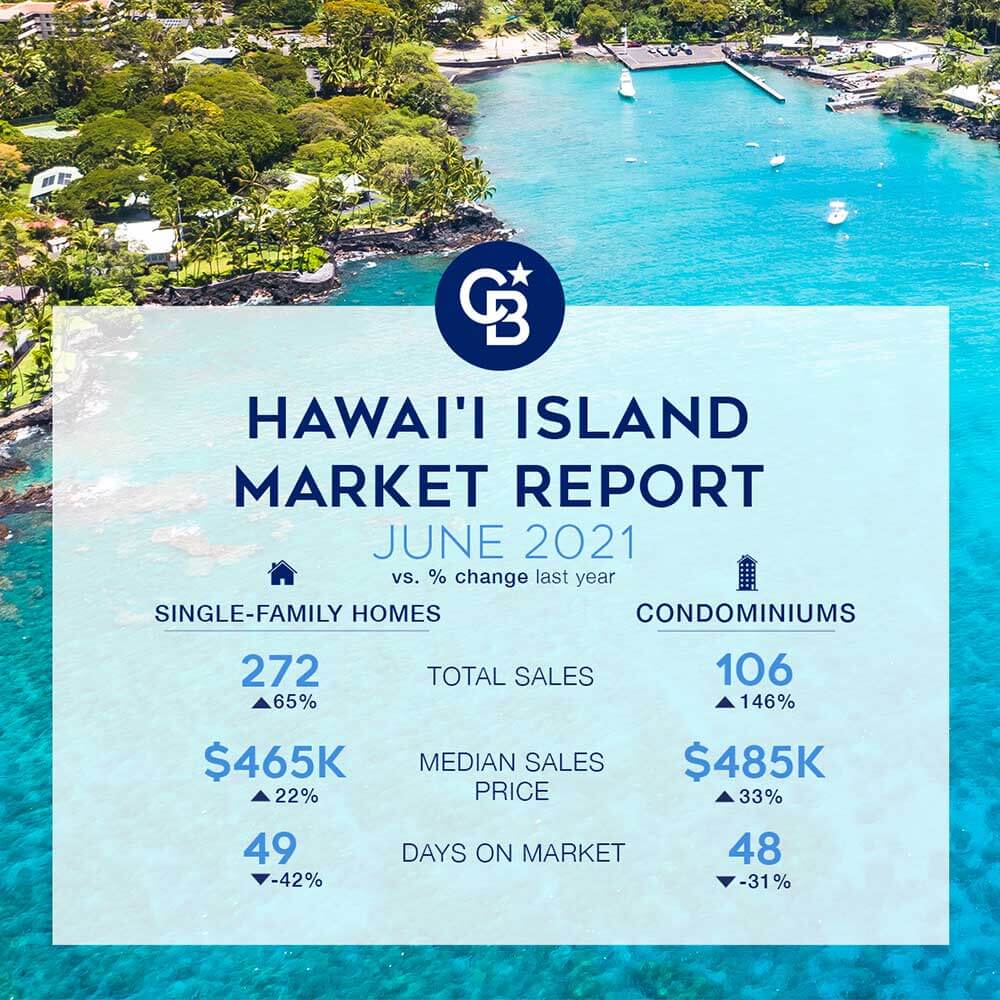
 The Hawaii Island real estate sales market was boiling January through April and has now boiled “dry” with no water left in the pot. Pending sales are stalled due to the lack of inventory for all classes of real estate except land and developed lots. The year-over-year statistics do not reveal much since the few sales we had in June of 2020 were “sight unseen” or “local” buyers due to the COVID travel lockdown. The most revealing statistics comprise a comparison between 2021 and 2019 sales for June and year to date. In June of 2019, 424 closed sales of all real estate classes and 2500 total sales year to date. In 2021 there were 733 closed sales and 4060 total sales year to date. That’s a 70% increase in total units sold island-wide year to date compared to 2019. The hottest market is for single-family homes on the East and south side of the island, where prices are lower. Single-family homes in the Kona market are doing very well also. Check out the links to the Hawaii Information Service Statistics for your area of interest.
What the statistics do reveal is exciting and what I’ve predicted for a while. Undeveloped Land is finally becoming the value class as well as where there is the most inventory available. This statistic would include houses on larger lots or acreage that are not your typical purchase of an out of State or off-island local buyer. Most real estate transactions along the Kohala Coast are condominium buyers who can lock, leave, and vacation rentals in the interim period, where the owner does not occupy the property themselves most of the time. I just put into escrow a property on Kapuna Road in Ahualoa for a client who plans to rent the property for 30+ as an extended stay vacation rental. A Short Term Vacation Rental permit isn’t required for rentals 30+ days, and there is a market, especially in the winter months, for extended vacation rental accommodations.
I do not predict an increase in the supply of resort condominiums; therefore, we will see price escalation to what will probably be the same as the 2006-2007 peak. I’ve lived in the Villages at Mauna Lani since 2003 and brokered many sales in my community since. I sold my adjacent neighbors Lehua plan for $1.250m in 2005. We have not seen that price level since on that particular plan, but I’m aware of a pending sale that could reach that level soon on the same unit type. Even if prices achieve this “peak” price, accounting for inflation, current prices would still be 5-6% less in real terms than the 2006 peak. The “peak” price paid for a Lehua unit was $1.4m in 2006. Let’s see what happens in the next few months.
If you are considering selling your property-THE TIME IS NOW TO LIST AND SELL. You will achieve a once-in-a-decade sales price even if this isn’t the absolute peak. Call me to discuss anytime!
I found a quote interesting in a Wall Street Journal article By Nicole Friedman on March 15, 2021. “The biggest winners in today’s boom are people who already own homes, who gained a collective $1.5 trillion in equity in 2020 from a year earlier, according to CoreLogic. They have also saved money by refinancing their mortgages at record-low rates. Many have started renovation projects or bought vacation homes.
Here are a few notable quotes from June 29, 2021, Corelogic report by Selma Hepp Executive, Research & insights and Deputy Chief Economist, Office of the Chief Economist:
“As the spring home-buying season took hold in April, there was no respite from demand, leading to home price growth rates that were last seen in 2005. In April, the S&P CoreLogic national Case-Shiller Index jumped a remarkable 14.6% year over year — the highest rate since the beginning of the index series.”
“The 10- and 20-city composite indexes also surged in April, up 14.4% and 14.9% year over year, respectively. The last time both indices had similar rates of growth was in 2005 (Figure 1). Compared to the prior peak in 2006, the 10-city composite is 19% higher, while the 20-city composite is 24% higher. However, when the two indices are adjusted for inflation, the 10-city index is still 6% below its 2006 peak, while the 20-city index is 2% below the previous peak.”
“In April, national home prices were 35% higher than the previous peak. Two cities remain below their previous peaks: Las Vegas and Chicago. By contrast, Denver’s prices have leaped 89% above its 2006 peak, followed by Dallas at 79% (Figure 3). While nominal prices have surpassed previous levels, when adjusted for inflation, national home prices were only 6% above the previous peak.”
“There are marked differences in today’s run up in prices compared to 2005, which was a bubble fueled by risky loans and lenient underwriting. Today, loans with high-risk features are absent, and mortgage underwriting is prudent. However, demand and supply imbalances — fueled by a drop in mortgage rates to less than one-half what they were in 2005 and a scarcity of for-sale homes — has fed the latest run-up in sales prices.” – Dr. Frank Nothaft, Chief Economist for CoreLogic
“National home prices increased 15.4% year over year in May 2021, according to the latest CoreLogic Home Price Index (HPI®) Report. The May 2021 HPI gain was up from the May 2020 gain of 4.2% and was the highest year-over-year gain since November 2005.”
Click here for links to the Corelogic Reports.
- Home Price Gains More Than Tripled Over the Past Year
- U.S. Home Price Insights
- U.S. S&P CoreLogic Case-Shiller Soars to Highest Growth Rate Since the Index Began
Click Here for the Hawaii Information Reports
- June 2021 Hawaii Island Market Statistics
- HIS June 2021 Consolidated Stats
- HIS June 2021 Market at A Glance
- HIS Sales Stats June 2021
Aloha,
Rick Oliver (B)
RB-18823
Coldwell Banker Island Properties
808-960-7330
[email protected]
![]()
![]()
![]()
![]()
![]()