
Review and forecast – Hawaii real estate market May 2021
Hawaii Information Service Statistics-Kohala Coast Resort Market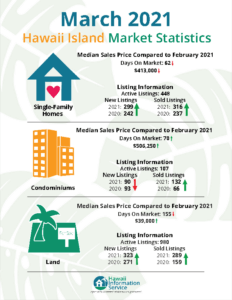
March 2021 vs 2020 Consolidated Statistics Island of Hawaii:
| Unit Volume | Listings | Sales
|
| Homes | +20% | +25% |
| Condos | +20% | +100% |
| Land | +16% | +45% |
Hawaii Information Service-Total Active Listings as of 5.10.21:
| Resort | Homes | Land | Condominiums |
| Mauna Kea | 5 | 11 | 0 |
| Mauna Lani | 3 | 4 | 2 |
| Waikoloa Beach Resort | 3 | 1 | 10 |
| Total | 11 | 16 | 12 |
Corelogic Report Highlights
Corelogic March 2021 Historic Data Comparison
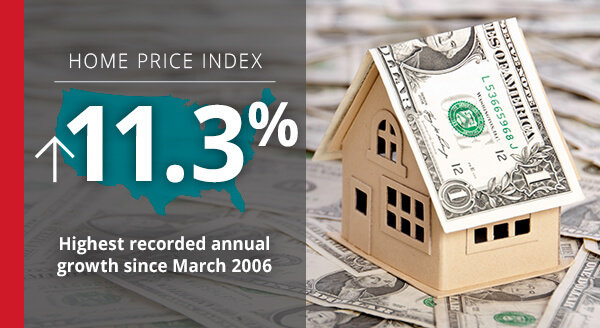
Home Price Insights – CoreLogic
-Home prices nationwide, including distressed sales, increased year over year by 11.3% in March 2021 compared with March 2020 and increased month over month by 2% in March 2021 compared with February 2021 (revisions with public records data are standard, and to ensure accuracy, CoreLogic incorporates the newly released public data to provide updated results).
-The CoreLogic HPI Forecast indicates that home prices will increase on a month-over-month basis by 1.1% from March 2021 to April 2021, and on a year-over-year basis by 3.5% from March 2021 to March 2022.
–As consumer confidence rebounds and the job market picks back up, the 2021 spring home buying season is on track to outpace trends seen in 2019 and 2018. Millennials lead the home buying charge with older millennials seeking move-up purchases and younger millennials entering peak home buying years. As we look towards the second half of the year, further erosion of affordability may dampen purchase demand as prospective buyers continue to compete for the severely limited supply of for-sale homes. A pick-up in construction and an increase in for-sale listings as more people get vaccinated may help moderate surging home price growth.
-“Lower-priced homes are in big demand and short supply, driving up prices faster compared to their more expensive counterparts. First-time buyers seeking a starter home priced 25% or more below the local-area median saw prices jump 15.1% during the past year, compared with the overall 11.3% gain in our national index.” – Dr. Frank Nothaft Chief Economist for CoreLogic
-Nationally, home prices increased 11.3% year over year in March. No states posted an annual decline in home prices. The states with the highest increases year-over-year were Idaho (25%), Montana (18.8%), and Arizona (18%).
-While home price changes on the local level vary, March gains across all of the top 10 metros surpassed their 2020 levels. However, metro areas where affordability constraints are prevalent continue to persist as prices rise. For instance, in March, home prices in San Diego increased 14% year over year and are forecasted to increase an additional 12.5% over the next 12 months.
-While home price changes on the local level vary, March gains across all of the top 10 metros surpassed their 2020 levels. However, metro areas where affordability constraints are prevalent continue to persist as prices rise. For instance, in March, home prices in San Diego increased 14% year over year and are forecasted to increase an additional 12.5% over the next 12 months.
-Conversely, The HPI Forecast also reveals the continued disparity in home price growth across metros. In markets like Houston, which was hit hard by the collapse of the oil industry and the recent hurricane season, home prices are expected to decline 0.5% by March 2022.
Aloha,
Rick Oliver (B)
RB-18823
Coldwell Banker Island Properties
808-960-7330
[email protected]
![]()
![]()
![]()
![]()
![]()