September 2020 Real Estate Update
Positive News For Sellers!!
The Island of Hawaii real estate market continues to churn out sales in lessor numbers than 2019 but Median Sales Prices have not declined, Year over Year, for the first 8 months of 2020 despite the virus pandemic which is limiting travel to Hawaii. This is positive news for sellers! Sellers who choose to sell to the limited number of buyers in the market are not experiencing any price declines. It is a seller’s market in the resort areas for condominiums +/-$1m.
If you are reading this and want to discuss listing your property for sale, I look forward to hearing from you!!
Summary Report:
Island Wide
The month of August, 2020 and first 8 months of 2020, year to date median prices are generally positive for home and condo values even though unit volume and sales volume are down compared to 2019.
August 2020
Condominium median sales prices for the month of August 2020 compared to August 2019 were up +46.15% and +11.35% for Homes. Vacant land was down -10.83%. These median sales prices are positive for condominiums and residential but only represent a low volume of sales and are only compared to one particular month in 2019. A better measure is the year to date stats.
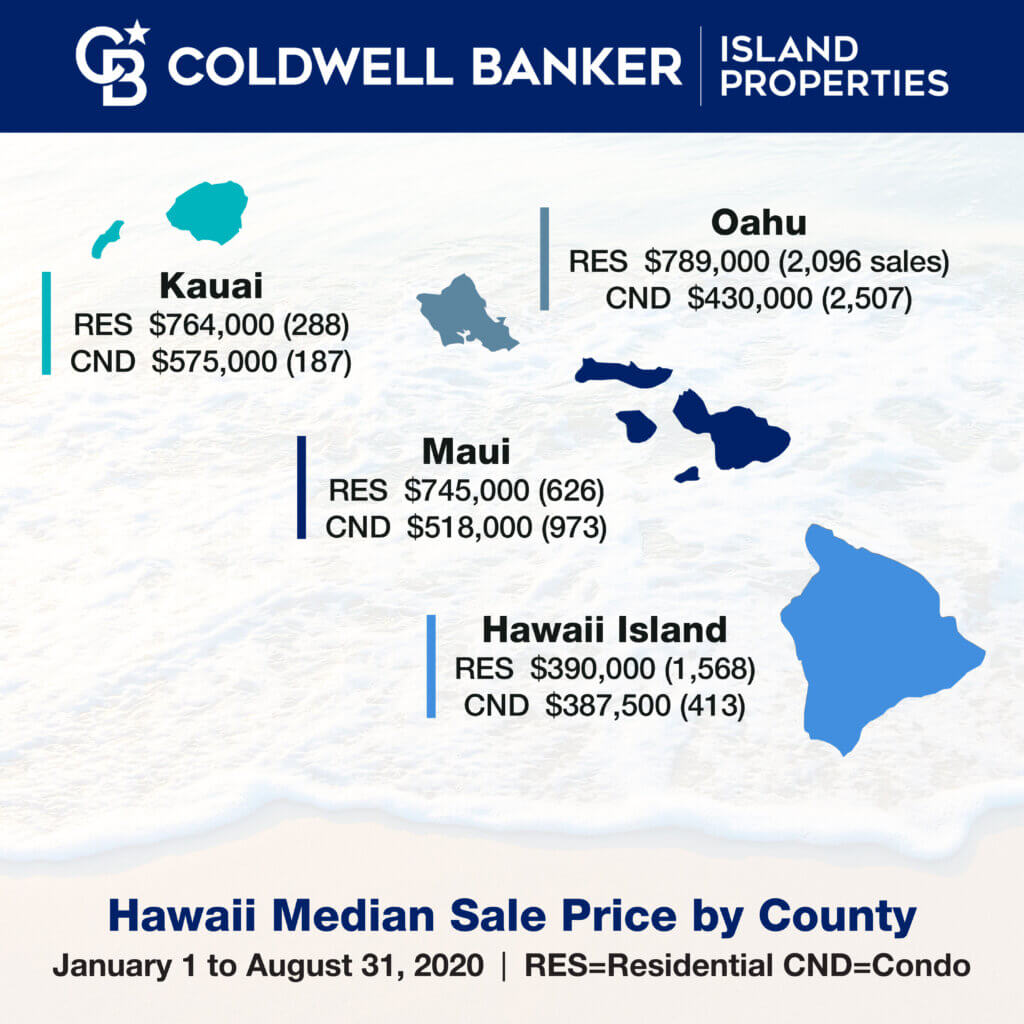
Median Sales Price-Year Over Year, first 8 months-2020
For a better perspective, the first 8 months of 2020 compared to the first 8 months of 2019, produced generally positive results for property values. The median sales price, island wide, for Condos were up +3.15%, Residential up +2.63% and Vacant Land is down -21.88 %.
North Kona
Year Over Year Sales Volume
2020 sales volume, Year over Year for the first 8 months of 2020 was generally negative except Residential which stayed near the same as 2019 in North Kona.
Residential volume was up +1.89%, Condominium volume was down -30.69%, Vacant land is down -45.80%.
Year Over Year Unit Volume
Residential down -10.36%, Condominiums down -31.29%, Vacant land down -19.28%.
Year Over Year Median Sales Price
Residential up +13.53%, Condominiums up +2.39% and Vacant land down -1.81%.
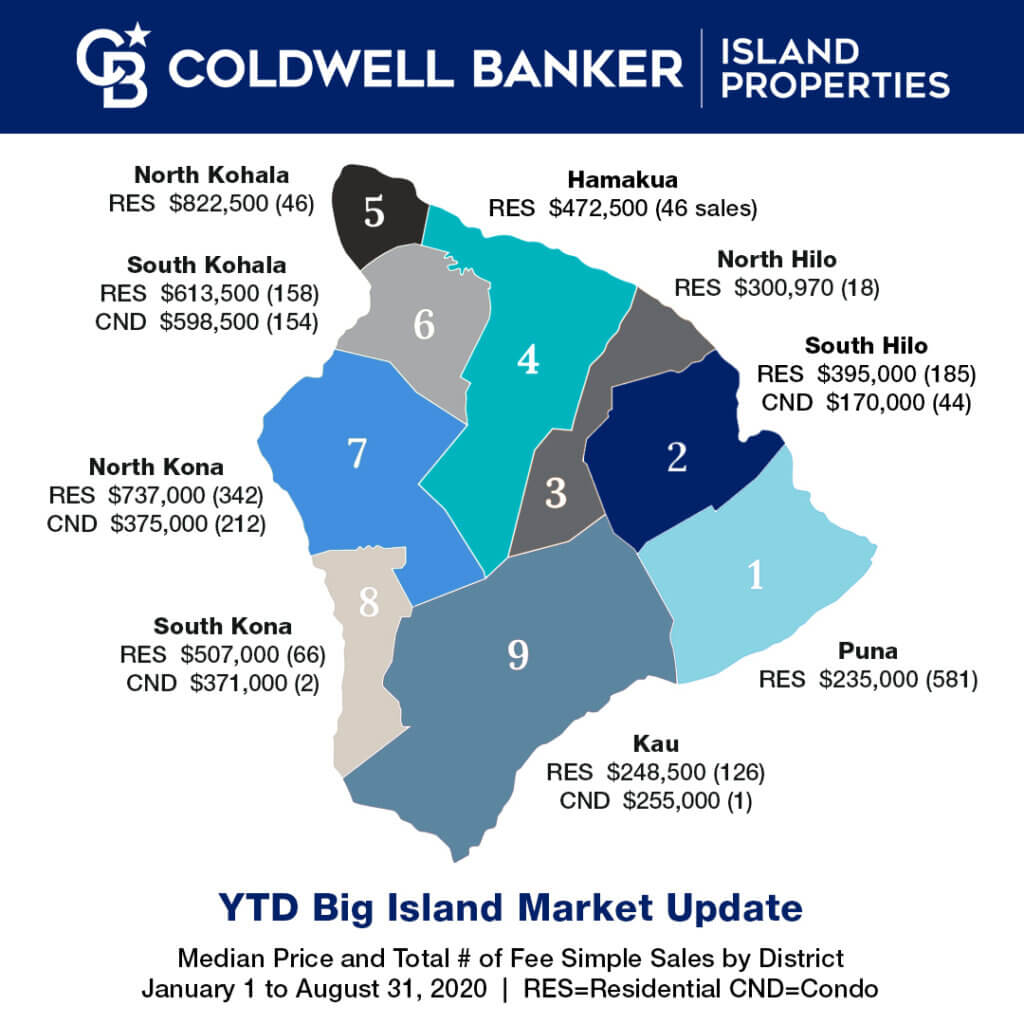
South Kohala District including Resorts
The positive stats for the South Kohala district which includes the 3 major resorts is impressive regarding Sales Volume and Median Sales Price for all categories of real estate. Even though there is a reduced number of sales except land transactions, prices are holding steady.
Year Over Year Sales Volume
Residential (+17.56%), Condominiums (-9.90%), and Vacant Land (+24.85%)
Year Over Year Unit Volume
Residential (-16.40%), Condominiums (-29.36%) and Vacant Land (+28.89)
Year Over Year Median Sales Price
Residential (+3.46%), Condominiums (+15.10), and Vacant Land (+5.54%)
Grigg’s Report Highlights
- The latest data from Hawaii Information Service for N. Kona residential market continues to show a tightening market. Inventory up slightly to 117 for homes priced below $4.0M. Pending sales have back off a notch to 108 from 14 two weeks ago. This has caused the Pending Ratio to decline to 92. It is likely that the record low interest rates plus the relatively virus free environment has contributed to this tight residential market. This is a nation-wide trend with Kona being above average. Median price for current 12 months sales has reached $701,000. In January that number was only $648,000. This is quite a remarkable change in the residential market in a short period of time.
- The price range data at the top of page 2 shows all but the over $4.0M price range are in or above the Sellers’ Market category. In the over $4.0M residential market, the average price of the two pending sales in $26.9M due to one escrow with a pending price of $45,000,000. I don’t think we have seen that before?
- The Hawaii Island Residential Pending Ratio has rebounded sharply in the last two months. East and West Hawaii both increased. The Pending Ratios are all above the Buyer’s Market category.
- The Charts 5 and Chart 6 related to the distressed property will be updated on a quarterly basis.
- The Condo stats are showing the effects of lack of tourist traffic. Year/Year Sales are off 22%. The good news is the situation is improving. There is an increase in Pending Sales.
Prices are holding up well. - The Land stats are showing the effects of lack of tourist traffic and lack of inventory. Unlike
condos the prices are showing a declining trend year over year. One interest stat that we have
not seen since the recovery began is the Pending Ratio which has final broken into the Neutral
market category. The tight residential market with its lean inventory and very high prices has
made the land market more attractive. Buying land and building new is making sense
economically. - Page 6 is the Pending Ratio Summary page. This page offers a quick glance of the Pending Ratio trend for N. Kona Res., Condo, Land and Hawaii Island. This table shows improvement from last year and also since last month. The higher price ranges of the Residential market appear to be the most improved.
- The Page 7 Kona Residential Price chart since 1972 is updated with the new 2019 data. This is based on a data pool of similar homes many of which are either new sales or resales over the years. The total number of sales that make up the data pool is over 7,644 in the 23 subdivisions in the study. The result shows the 2019 average price was (plus six percent +6%) or $650,900.
If you distribute material from the Griggs Report online, on your website or blog, etc., please include appropriate attribution. An example is provided below.
The Griggs Report is published semi-monthly by Michael B. Griggs, PB, GRI
Sincerely,
Mike
Michael B Griggs PB, GRI, RB-12532
73-1201 Mahilani Dr.
Kailua-Kona, HI 96740
Direct PH: 808 936-8134
Email: [email protected]
Click here for the Grigg’s Report for an in depth analysis.
Click here for the MLS data for all classes of real estate in all island wide zones.
Aloha,
Rick Oliver (B)
RB-18823
Coldwell Banker Island Properties
808-960-7330
[email protected]
![]()
![]()
![]()
![]()
![]()