
January 2017 National Real Estate Statistics Summary
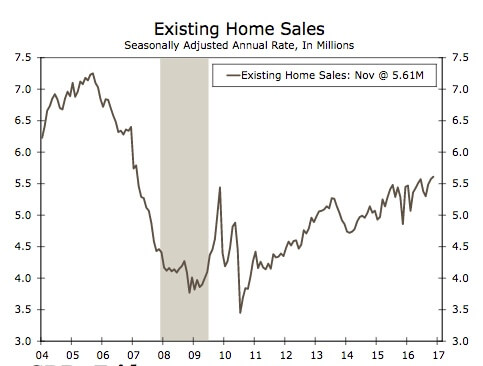
- Existing home sales fell 2.8% in December to an annualized rate of 5.49 million units. November’s pace of 5.65 million units was the strongest monthly rate in nearly 10 years. 1
- For the year, existing home sales numbered 5.45 million units in 2016, up 3.8% from sales of 5.25 million units in 2015. Last year had the highest level of sales since 6.48 million existing homes were sold in 2006. 1
- The number of existing homes on the market in December fell to 1.65 million units, its lowest level since NAR began tabulating housing inventory in 1999. That’s a 6.3% drop from the housing inventory in December 2015, leaving the months’ supply figure at 3.6 months. 1
- The median price of existing homes sold in December was $232,200, up 4.0% from December 2015. Over the last three years, the median price has increased at a 5.5% average annual rate. 1
- New home sales dropped 10.4% in December to an annual rate of 536,000 units. Sales climbed 12.2% in 2016, to 563,000 units from 501,000 units in 2015. 2
- The median price of new homes sold in December was $322,500, up 7.9% from December 2015. Over the last three years, the median price has increased at a 5.4% average annual rate. 2
- Annual mortgage insurance premiums on FHA loans will remain at current levels after the Trump administration “suspended indefinitely” the premium cuts announced eleven days earlier by the outgoing Obama administration. The action was taken to allow for more analysis on the impact of any premium change on the FHA’s capital reserves. 3
- Manufacturing production rose 0.2% in December. Over the past year, manufacturing rose 0.2% as well, down from its average annual increase of 0.7% over the past three years. 4
- The average rate on 30-year fixed-rate mortgages in Freddie Mac’s survey was 4.19% during the week ending January 26, up 10 basis points from the previous week. January’s average was 4.15%, down from 4.20% in December. October averaged 3.47%. All rates quoted have fees and points averaging 0.4% to 0.6% of the loan amount. 5
Click Here for January 20, 2017 Wells Fargo Weekly Economic and Financial Commentary.
- “Existing-Home Sales Slide in December; 2016 Sales Best Since 2006”, National Association of Realtors®, January 24, 2017.
www.nar.realtor/news-releases/2017/01/existing-home-sales-slide-in-december-2016-sales-best-since-2006 - “New residential sales in December 2016,” Census Bureau, January 26, 2017.
www.census.gov/construction/nrs/pdf/newressales_201612.pdf - “Suspension of Mortgagee Letter 2017-01 — Reduction of Federal Housing Administration (FHA) Annual Mortgage Insurance Premium (MIP) Rates,” Mortgagee Letter 2017-07, January 20, 2017.
portal.hud.gov/hudportal/documents/huddoc?id=17-07ml.pdf - “Industrial Production and Capacity Utilization,” Release G.17, Federal Reserve Board of Governors, January 18, 2017.
www.federalreserve.gov/releases/g17/Current/g17.pdf - Freddie Mac Primary Mortgage Market Survey, Jan 26, 2017.
www.freddiemac.com/pmms/.
The Federal Reserve Bank of St Louis Economic Data system (FRED) was used to collect historical data on nonfarm payroll employment, the unemployment rate, and the CPI.
Aloha,
Rick Oliver (B)
RB-18823
Coldwell Banker Island Properties
808-960-7330
[email protected]
![]()
![]()
![]()
![]()
![]()