November 2020 Market Update
Continued Positive News For Sellers!!
The Island of Hawaii real estate market continues to churn out sales in lessor numbers and volumes than 2019 but Median Sales Prices have not declined, Year over Year, for the first 11 months of 2020 despite the virus pandemic which is limiting travel by buyers and sellers to Hawaii. This is positive news for sellers! Buyers have less to choose from and prices have firmed up. Sellers usually start listing their properties when they arrive for the winter season which is forthcoming soon in January. This could increase inventories which could quell the issue of low inventory-maybe not.
There are still plenty of buyers seeking quality homes and condominiums as mainland markets have become over valued-see the Corelogic Report. Compared to the 2007 market peak on the Kohala Coast, most resort condominiums are still selling below these values. Adjusted for inflation, they are selling way below these prices. Sellers who choose to sell to the limited number of buyers in the market are not experiencing any price declines. It is a seller’s market in the resort areas for condominiums +/-$1m.
If you do not read past this point in my blog post, look at the Year over Year stats for South Kohala. All classes of Real Estate median sales prices are positive. Check out the South Kohala Land sales stats, they are extremely positive. I have always said to my clients that South and North Kohala land is a bargain and it looks like it is finally due for a positive run.
Typically this signals that buyers are not finding value in already constructed residential product and they buy land in order to build and create value for themselves. I suspect our local building industry will be well supported in the future as these buyers will now build new homes for themselves. This can also signal a peak in the market place as land is usually the last class of real estate to accelerate in a real estate sales cycle.
If you are reading this and want to discuss listing your property for sale, I look forward to hearing from you!! This is a great time to sell all classes of real estate!!
Summary Report:
Island Wide
November 2020
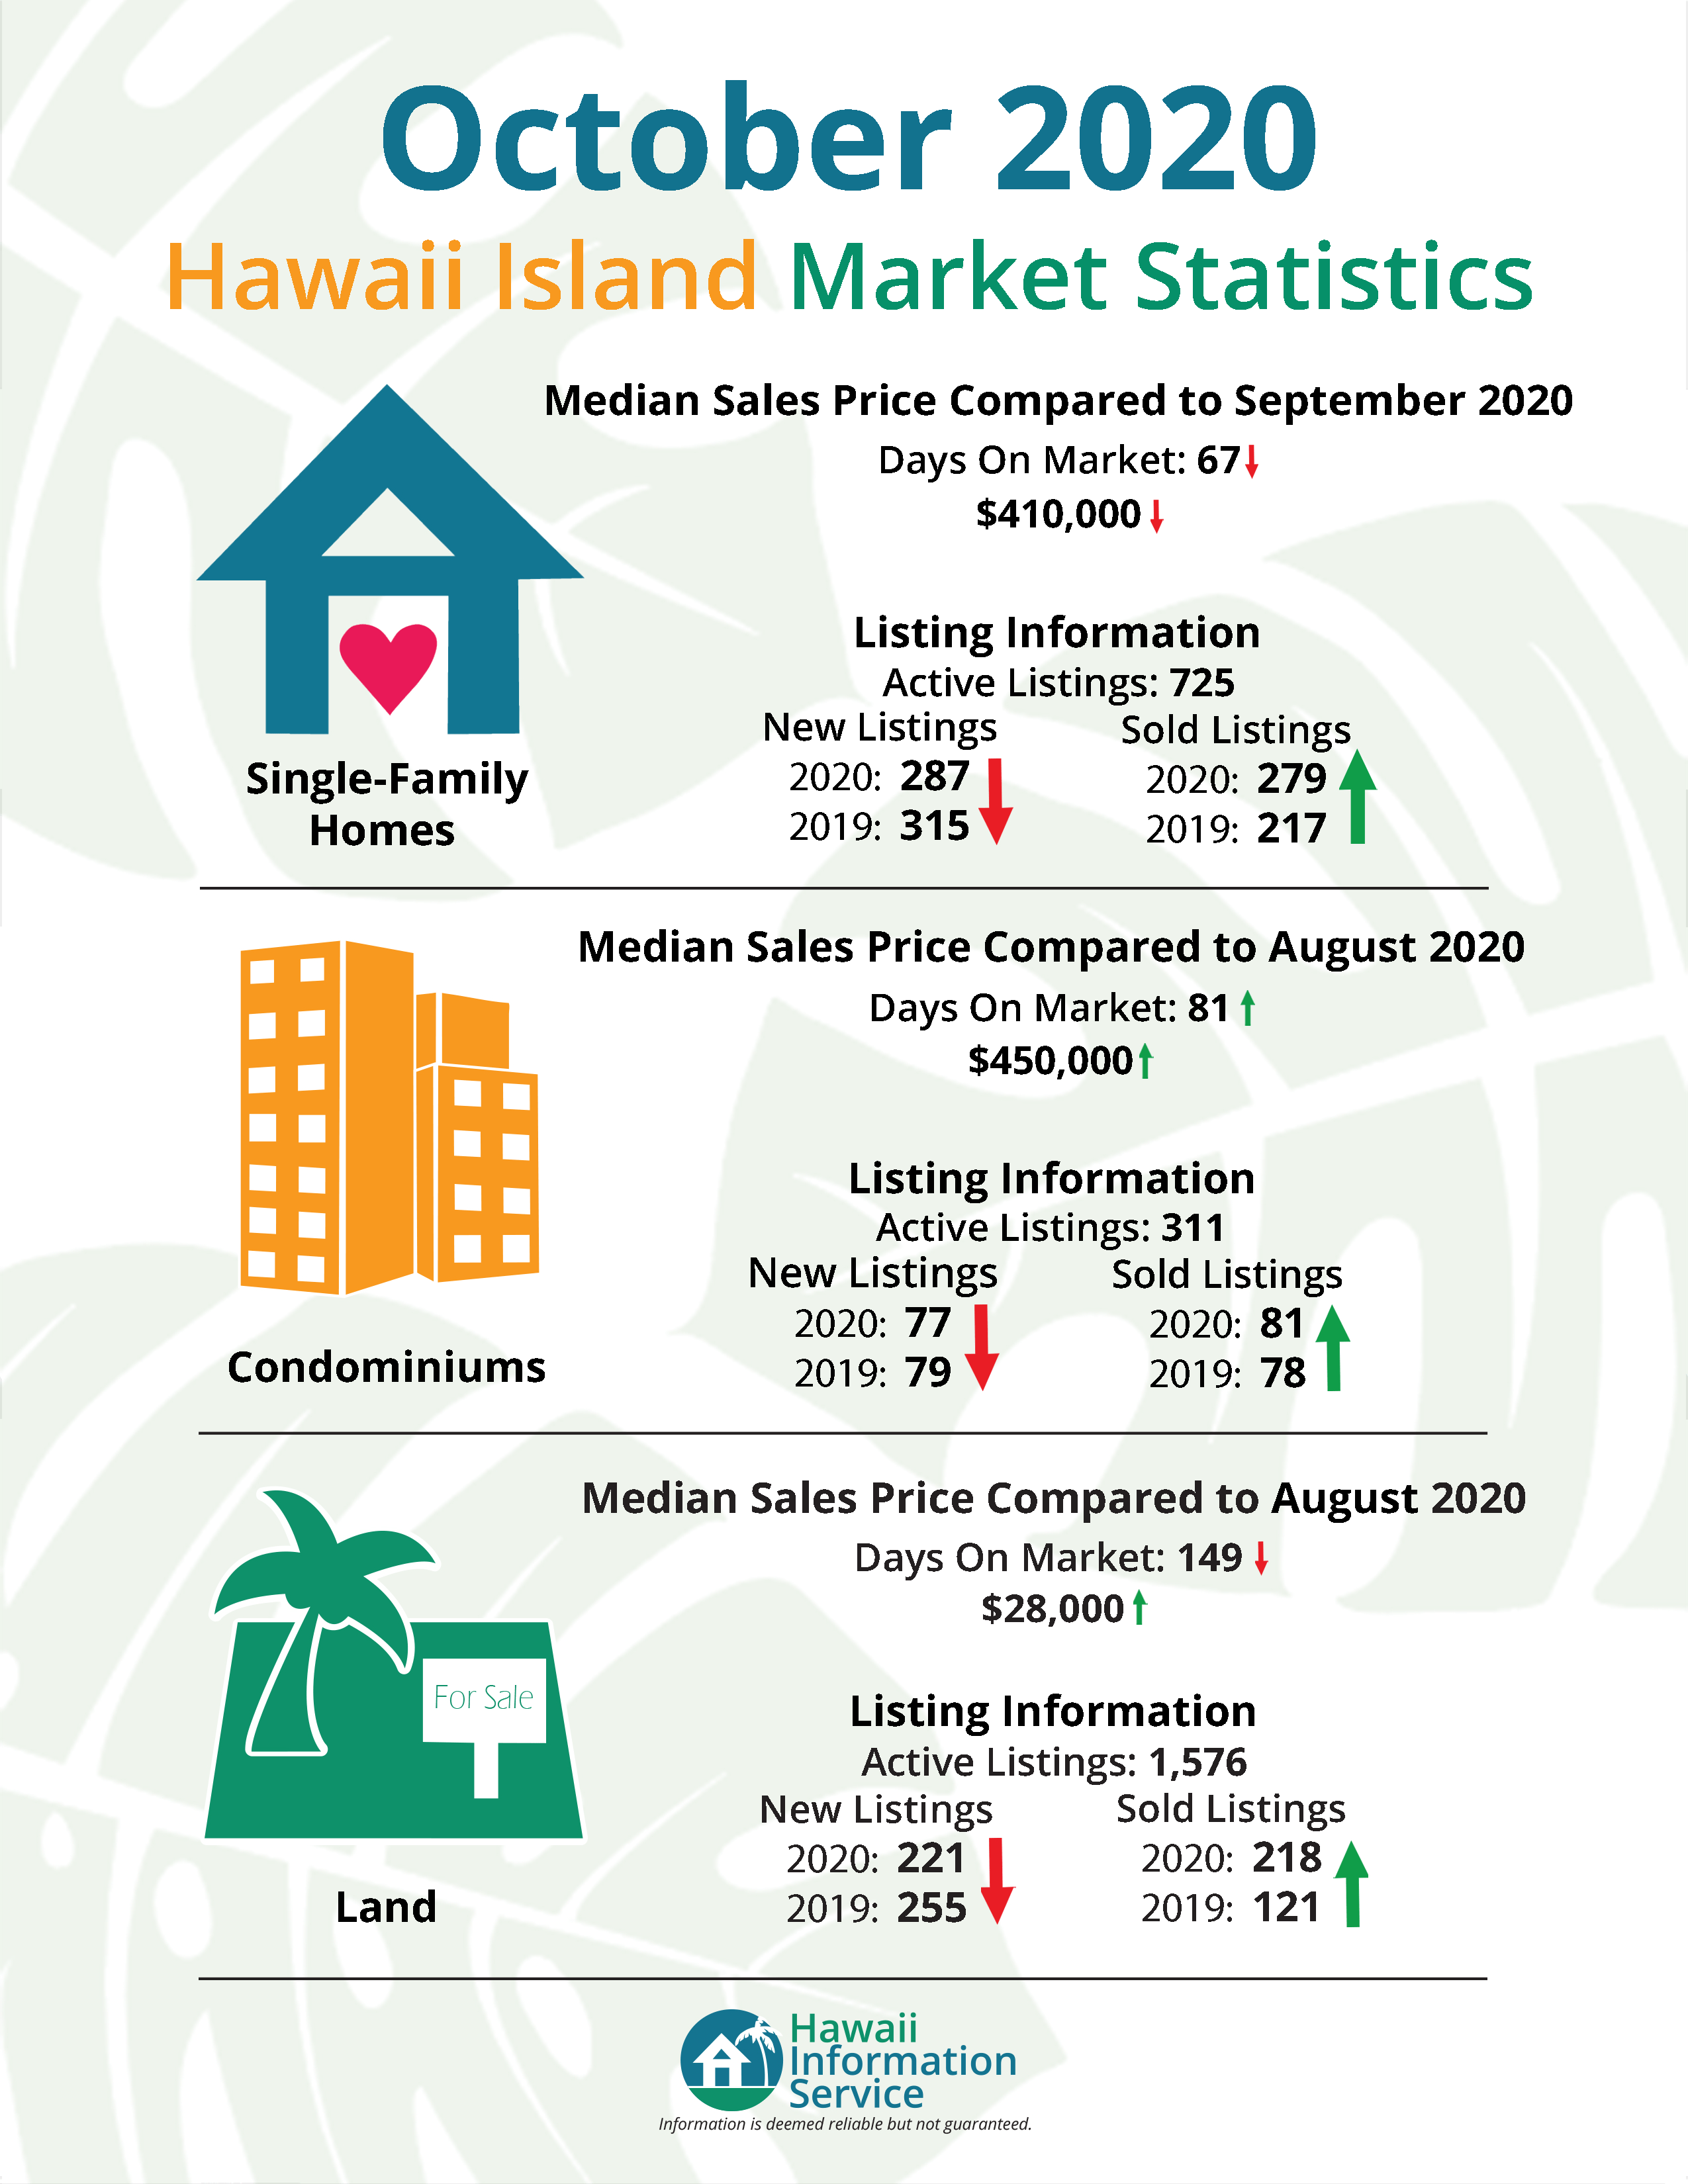
Condominium median sales prices for the month of November 2020 compared to November 2019 were up +20.05% for condominiums and +18.88% for Homes. Vacant land was down -16.67%. Median sales prices are positive for condominiums and residential but only represent a low volume of sales and are only compared to one particular month in 2019. A better measure is the year to date stats.
Year to Date-Median Sales Price-Year Over Year, first 11 months-2020 vs. 2019
For a better perspective, the first 11 months of 2020 compared to the first 11 months of 2019, produced generally positive results for property values. The median sales price, island wide, for Condos is up +8.22%, Residential positive +5.87% and Vacant Land values are down -17.07%.
North Kona
Year Over Year Sales Volume
The 2020 sales volume for North Kona area, Year Over Year, for the first 11 months of 2020 is negative (-5.37%) for condominiums and barely positive (+4.81%) for Residential which we know now reflects a lack of inventory not lack of buyer interest since prices are increasing.
Year Over Year Unit Volume
The lack of inventory is producing mixed results regarding the total number of units sold vs. 2019.
Residential down -2.78%, Condominiums down -15.66%, Vacant land up 37.50%.
Year Over Year Median Sales Price
Residential up +14.46%, Condominiums up +6.01% and Vacant land up +1.54%.
November 2020 vs. November 2019
The Sales Volume of Residential closed sales for the month of November 2020 vs. November 2019, which reflect the pending sales of the previous 60 days is up +35.13% for residential and up +112.51% for condominiums vs. November 2019.
South Kohala District including Resorts
Year Over Year Sales Volume
The 2020 sales volume ($) for South Kohala area, Year Over Year, for the first 11 months of 2020 is positive (+20.74%) for condominiums and very positive (+50.70%) for Residential.
Year Over Year Unit Volume
The lack of inventory is producing mixed results regarding the total number of units sold vs. 2019.
Residential up +3.28 %, Condominiums down -19.30%, Vacant land up 6.36%.
We need more condominium listings!
Year Over Year Median Sales Price
Residential up +11.39%, Condominiums up +16.26% and Vacant land up +15.46%.
November 2020 vs. November 2019
The Sales Volume of Residential closed sales for the month of November 2020 which reflect the pending sales of the previous 60 days is up +82.45% for residential and up +143.39% for condominiums vs. November 2019. The November closed sales are on FIRE on the Kohala Coast!!!
CoreLogic, a data and analytics company. Report Highlights:
COVID-19 Impact on Home Prices
Home prices climbed in recent months due to heightened demand and ongoing home supply constraints. The supply shortage could further intensify as COVID-19 cases continue to rise and would-be sellers remain hesitant about putting their homes on the market. However, to keep up with the rising demand, new home construction surged in October and builder confidence reached a new high for the third consecutive month. The decreased pressure on supply could moderate home price growth over the next year. This is reflected in the CoreLogic HPI Forecast, which shows home prices slowing to 1.9% by October 2021. However, should the economic recovery from the pandemic be more robust, then we would expect projections for home price performance to improve.
Nationally, home prices increases 7.3% year over year in October. No states posted an annual decline in home prices. The states with the highest increases year-over-year were Maine (14.9%), Idaho (13.1%), and Arizona (12%).
The pandemic has shifted home buyer interest toward detached rather than attached homes. Detached homes offer more living space and are typically located in less densely populated neighborhoods. And while prices of single-family detached homes posted an annual increase of 7.9% in October, the price of attached homes rose only 4.5% year over year.
– Dr. Frank Nothaft
Chief Economist for CoreLogic
Grigg’s Report Highlights
Aloha,
The purpose of the Griggs Report is to provide the reader with accurate market data that gives an up-to-date view of the real estate market trends in N. Kona and Hawaii Island. Price Direction and Rate of Price Change are important indicators most are looking for. However price data is based on past sales. Current market inventory levels and pending sale trends show more current trends and give clues as to future price direction and rate of change. The report uses the “Pending Ratio”, the ratio of Pending Sales to Active Listing Inventory as a measure of this current supply/demand dynamic. By following the Pending Ratio’s over time the report uses charts to illustrate the trends. The higher the ratio number, the tighter or stronger the market demand versus supply.
- The latest data from Hawaii Information Service for N. Kona residential market continues to show a tightening market. Inventory is at the lowest level for this date since the stats were first reported. Pending sales are strong and probably would be higher if it weren’t for the lack of inventory. This has caused the Pending Ratio to reach a new recovery high. The current data trend shows several similarities to the peak demand years of 2003 and 2004. Eventually price rose to peak price in 2006-7 and the cycle ended. It will be very interesting to see if that same pattern plays out in the next few years? Median Price is now up +16% and 30 day sales are at recovery peak of 68.
- The price range data at the top of page 2 shows prices ranges up to $1.5M are in the PEAK demand category. There are only 27 homes now listed below $700,000.
- The Hawaii Island Residential Pending Ratio had rebounded sharply since April, but that trend just ended when the East HI ratio declined. West HI ratio is still climbing.
- The Charts 5 and Chart 6 related to the distressed property shows very low levels of distressed properties on the market. This chart will be updated December 31.
- The Condo stats are showing the effects of lack of tourist traffic. Year/Year Sales are off (-19%). The good news is the situation is improving. There is an increase in Pending Sales. Prices are moving higher again at +10% over last year’s price.
- The Land stats are following the trend of the improved residential market with sharp decline in inventory and conversely Pending Sales improved at a greater rate. Prices are stable in this report after steep increase the previous month.
- Page 6 is the Pending Ratio Summary page. This page offers a quick glance of the Pending Ratio trend for N. Kona Res., Condo, Land and Hawaii Island. This table shows improvement from last year and also since last month. The higher price ranges of the Residential market appear to be the most improved.
- The Page 7 Kona Residential Price chart since 1972 is updated with the new 2019 data. This is based on a data pool of similar homes many of which are either new sales or resales over the years. The total number of sales that make up the data pool is over 7,644 in the 23 subdivisions in the study. The result shows the 2019 average price was (plus six percent +6%) or $650,900.
If you distribute material from the Griggs Report online, on your website or blog, etc., please include appropriate attribution. An example is provided below.
The Griggs Report is published semi-monthly by Michael B. Griggs, PB, GRI
Sincerely,
Mike
Michael B Griggs PB, GRI, RB-12532
73-1201 Mahilani Dr.
Kailua-Kona, HI 96740
Direct PH: 808 936-8134
Email: [email protected]
Click here for the Grigg’s Report for an in depth analysis.
Click here for the MLS data for all classes of real estate in all island wide zones.
Aloha,
Rick Oliver (B)
RB-18823
Coldwell Banker Island Properties
808-960-7330
[email protected]
![]()
![]()
![]()
![]()
![]()