Real Estate Market Update Big Island May 2017
As we exit the 2016/2017 Winter/Spring, high season for real estate sales, I thought it would be helpful to assess the positive market trends for 2016/2017/2018. Here is a synopsis of some helpful statistics I gathered from Title Guaranty, Corelogic and the Hawaii Information Service (Multiple Listing Service). Please scroll down or click the links for more detail. If you would like a more detailed analysis of your community and or your particular property please click here to contact me!
Title Guaranty reports Canadians comprise the most foreign buyers to the Big Island even though buyers from Japan purchase the most properties statewide. The positive news regarding Canadian purchases is despite their currency woes and low prices for their energy products. Seems as though a few Canadians are unaffected or the lure of Hawaii from the cold north is too hard to resist.
Corelogic reports a +7.1% average home price increase for first quarter 2017 compared to 2016 for the entire USA. They also report +62 consecutive positive growth months since 2010 even though the growth is in the single digits currently down from a +10% high. Corelogic predicts a lower growth rate for the state of Hawaii but positive gains at least until 2022-good news.
In March 2017, Oahu and Maui are listed as “Overvalued” by Corelogic plus one-hundred and four other markets in the US with sixteen of them in Texas. “Market Condition Indicators compare the distance between a market’s long-term fundamental value and HPI. An overvalued or undervalued market is defined as having a current Home Price Index of 10 percent above or below the long-term fundamental value for that market. Market Condition Indicators are available for most Metropolitan areas.”
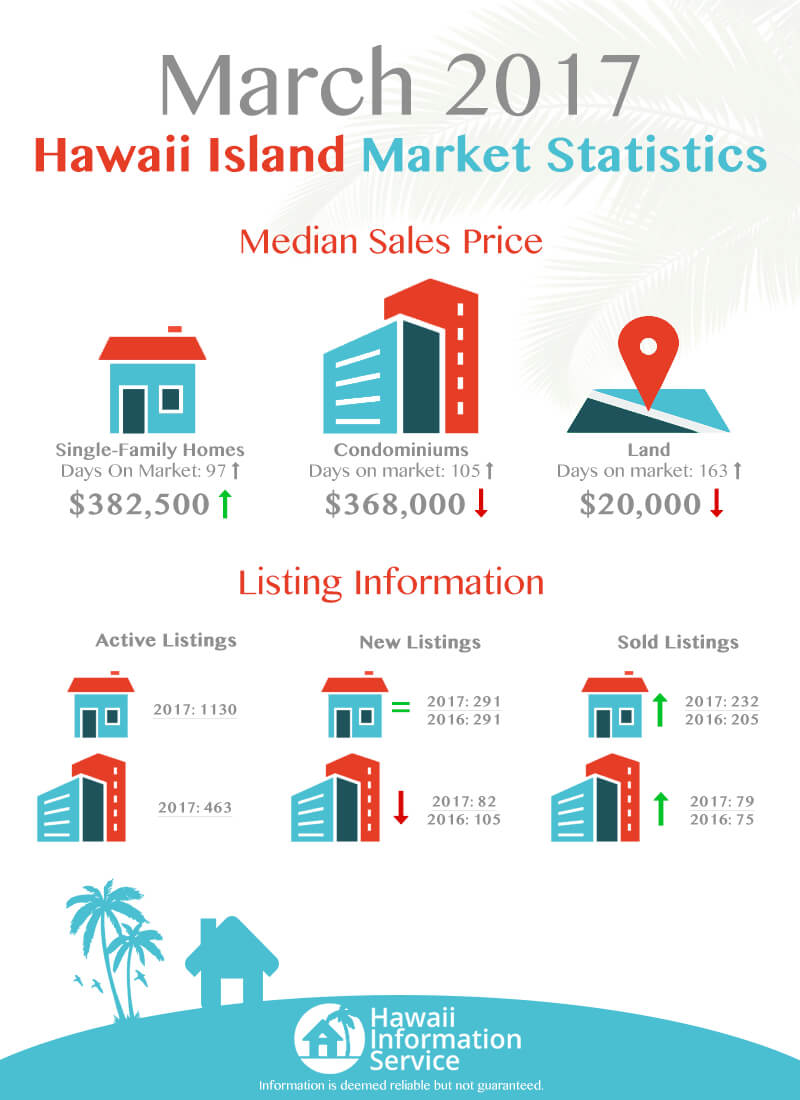
Hawaii Information Service reports year over year statistics for the Island of Hawaii as follows-most stats show positive gains:
- +1.2% Increase in sales transaction Year over Year # of from April 1 2016 to March 31 2017.
- +11.11% Increase in median sales price Year over Year from April 1, 2016 to March 31, 2017.
- -3.32 Decrease in total sales volume Year over Year from April 1, 2016 to March 31, 2017.
Highlights of the Hawaii Information Service report for the South Kohala District including the major Kohala Coast resorts including the Waikoloa Beach Resort, Mauna Lani Resort, Mauna Kea Resort, Puako, Waikoloa Village and Waimea are also positive:
Single Family Homes:
- -17.53% Decrease in Year over Year # of sales transaction from April 1 2016 to March 31 2017.
- +55.71% Increase in total sales volume Year over Year from April 1, 2016 to March 31, 2017.
- +22.98% Increase in median sales price Year over Year from April 1, 2016 to March 31, 2017. $483k to $594k.
Condominiums:
- +6.98 Increase in # of sales transaction Year over Year from April 1 2016 to March 31 2017.
- +6.66% Increase in total sales volume Year over Year from April 1, 2016 to March 31, 2017.
- +9.83% Increase in median sales price Year over Year from April 1, 2016 to March 31, 2017. $432,500k to $475k.
Again and importantly-Please scroll down or click the links for more detail. If you would like a more detailed analysis of your community and or your particular property please click here to contact me! I am more than happy to assist in evaluating your home-it’s a great time to buy and sell in Hawaii.
- Click Here for the Hawaii Information Market Report
- Click Here for the 2017 Mauna Lani Resort Condominium Sold Information
Sincerely,
Rick Oliver R (Broker) RB 18823
Clark Realty Corporation
Over 30 Years of Real Estate experience!
Search MLS on our WEBSITE
Title Guaranty Information
According to Title Guaranty’s records, these were the total # of Big Island sales to foreign buyers in 2016:
- Canada: 17 (116 statewide)
- Japan: 14 (581statewide)
- Germany: 2
- Saipan: 2
- Korea: 2
- Italy: 2
See this link to graphic representation
Corelogic reports the following for the US market and the State of Hawaii
Corelogic-United States Real Estate Market 2016/2017
- + 1.6% Month over Month increase in home values for US for March 2017. Excluding distressed sales prices rose +1.5%
- + 7.1% Year over Year increase in home values for US for March 2017. Excluding distressed sales prices rose 5.9%.
- +0.6% Forecasted Month over Month % change-March/April 2017
- +4.9% Forecasted Year over Year Percentage Change March 2017 to March 2018
- +62 Consecutive Months Including distressed sales, the U.S. has experienced
- 62 consecutive months of year-over-year increases; however, the national increase is no longer posting double-digit gains.
- −2.8%: Including distressed sales, national single- family home prices remain 2.8% below peak values recorded in April 2006.
- August 2017: Including distressed sales, national single-family home prices are forecasted to reach a new peak level in August 2017.
Corelogic – State of Hawaii-2017/2018
- +.1% Month over Month increase in home values for all islands for March 2017.
- +6.4% Year over Year increase in home values for all islands from March 2016 to March 2017.
- +.6% Forecasted percentage change from March 2017 to April 2017.
- +6.7% Forecasted percentage change from March 2017 to April 2018.
“Home prices posted strong gains in March 2017, and the CoreLogic Home Price Index is only 2.8 percent from its 2006 peak. With a forecasted increase of almost 5 percent over the next 12 months, the index is expected to reach the previous peak during the second half of this year. Prices in more than half the country have already surpassed their previous peaks, and almost 20 percent of metropolitan areas are now at their price peaks. Nationally, price growth has gradually accelerated over the past half-year, while rent growth for single-family rental homes has slowly decelerated over the same period, according to the CoreLogic Single-family Rental Index, recording a 3 percent rise over the year through March.” Dr. Frank Nothaft, chief economist for CoreLogic
Hawaii Information Services (MLS) Island of Hawaii Statistics
April 2017 Island Wide Statistics
Number of Sales transactions:
- +6.63% Increase in Month over Month # of sales transactions for the month of April 2016/April 2017
- +1.2% Increase in Year over Year # of sales transaction from April 1 2016 to March 31 2017.
Sales Volume:
- +9.01 Increase in total sales volume Month over Month for April 2016/2017.
- -3.32 Decrease in total sales volume Year over Year from April 1, 2016 to March 31, 2017.
Median Sales Price:
- -4.14% Decrease in median sales price for the Month over Month for April 2016/2017.
- +11.11% Increase in median sales price Year over Year from April 1, 2016 to March 31, 2017.
Hawaii Information Services (MLS) Island of Hawaii Statistics-South Kohala Area including the Mauna Lani Resort, Waikoloa Beach Resort, Mauna Kea Resort, Waikoloa Village and Waimea.
Number of Sales transactions:
Residential
- -32.00% Decrease in Month over Month # of sales transactions for the month of April 2016/April 2017
- -17.53% Decrease in Year over Year # of sales transaction from April 1 2016 to March 31 2017.
Condominiums
- -26.47 Decrease in Month over Month # of sales transactions for the month of April 2016/April 2017
- +6.98 Increase in Year over Year # of sales transaction from April 1 2016 to March 31 2017.
Sales Volume:
Residential
- +79.58% Increase in total sales volume Month over Month for April 2016/2017.
- +55.71% Increase in total sales volume Year over Year from April 1, 2016 to March 31, 2017.
Condominiums
- -8.10% Increase in total sales volume Month over Month for April 2016/2017.
- +6.66% Increase in total sales volume Year over Year from April 1, 2016 to March 31, 2017.
Median Sales Price:
Residential
- +20.05% Increase in median sales price for the Month over Month for April 2016/2017. $581K to $630,240k.
- +22.98% Increase in median sales price Year over Year from April 1, 2016 to March 31, 2017. $483k to $594k.
Condominiums
- -2.75% Decrease in median sales price for the Month over Month for April 2016/2017. $437k to $435k.
- +9.83% Increase in median sales price Year over Year from April 1, 2016 to March 31, 2017. $432,500k to $475k.
Aloha,
Rick Oliver (B)
RB-18823
Coldwell Banker Island Properties
808-960-7330
[email protected]
![]()
![]()
![]()
![]()
![]()