Q2 2017 Market Report
As we enter the 3rd Quarter of 2017 in the middle of our summer sales season, I thought it would be helpful to assess the positive market trends so far for the State and island of Hawaii and the US for 2017. Below is a synopsis of some helpful statistics I gathered from the States largest escrow company-Title Guaranty, Corelogic and our Multiple Listing Service-Hawaii Information Service.
The stats indicate a general positive trend with +6% average value increase nationwide-Year over Year-and for most areas of the State of Hawaii.
For particular note, these stats show an above average, positive result for my particular market area:
South Kohala Resort District:
+15.51% Increase in median sales price of single family homes YTD 2017 vs. YTD 2016 South Kohala Resort District.
+18.03% Increase in the total number of condominium homes sold YTD 2017 vs. YTD 2016 South Kohala Resort District.
+15.61% Increase in median sales price of condominium homes YTD 2017 vs. YTD 2016 South Kohala Resort District.
Again and importantly-Please scroll down or click the links for more detail. If you would like a more detailed analysis of your community and or your particular property please click here to contact me! I am more than happy to assist in evaluating your home-it’s a great time to buy and sell in Hawaii.
Sincerely,
Rick Oliver R (Broker) RB 18823
Clark Realty Corporation
Over 30 Years of Real Estate experience!
Corelogic
Dr. Frank Nothaft, Executive and Chief Economist with Corelogic reports the following:
Comparing home sales for the first five months of the year, 2017 has had the best sales market in a decade. The reasons for the rise in sales include the lowest unemployment rate since 2001, low mortgage rates, the rosiest consumer confidence in 17 years, and growing numbers of millennials looking to buy.
Various indicators underscore the frenetic pace of sales. ‘Hot’ markets, those with robust demand relative to the limited number of homes for sale, have a short number of days-on-market before sale. We examined listing and sales data from Multiple Listing Services across 66 metros and found that 18 percent of homes sold in under 30 days this spring, the highest share in at least 17 years.
These patterns are not uniform across the U.S. but vary depending on the strength of local economies and the demand-and-supply balance across neighborhoods. The San Francisco Bay area has seen strong purchase desires bump up against very limited inventory, resulting in about three-fourths of homes selling above their list price. In Seattle, three-in-five homes have sold this spring above their list price, and has been a reason why the Seattle area tops all other metros in home-price growth over the past year, at 14 percent through May according to the CoreLogic Home Price Index.
At the other end of the gamut, in southeast Florida, an area encompassing Miami and West Palm Beach, less than 10 percent of all homes sold above their list price, reflecting some of the remaining housing overhang in those markets.
Whether next spring tops 2017 in home sales will depend on the health of the overall economy, the level of mortgage rates, and the supply of homes listed for sale.
CoreLogic, a data and analytics company-July 2017
Title Guaranty
Title Guaranty-Report indicate the following positive results for Statewide real estate sales:
Statewide Single Family Homes
+4.2% Increase in the total number of single family homes sold YTD 2017 vs. YTD 2016 Statewide.
+3.2% Increase in median sales price of single family homes YTD 2017 vs. YTD 2016 Statewide.
Statewide Condominium Homes
+8.9% Increase in the total number of condominium homes sold YTD 2017 vs. YTD 2016 Statewide.
+3.6% Increase in median sales price of condominium homes YTD 2017 vs. YTD 2016 Statewide.
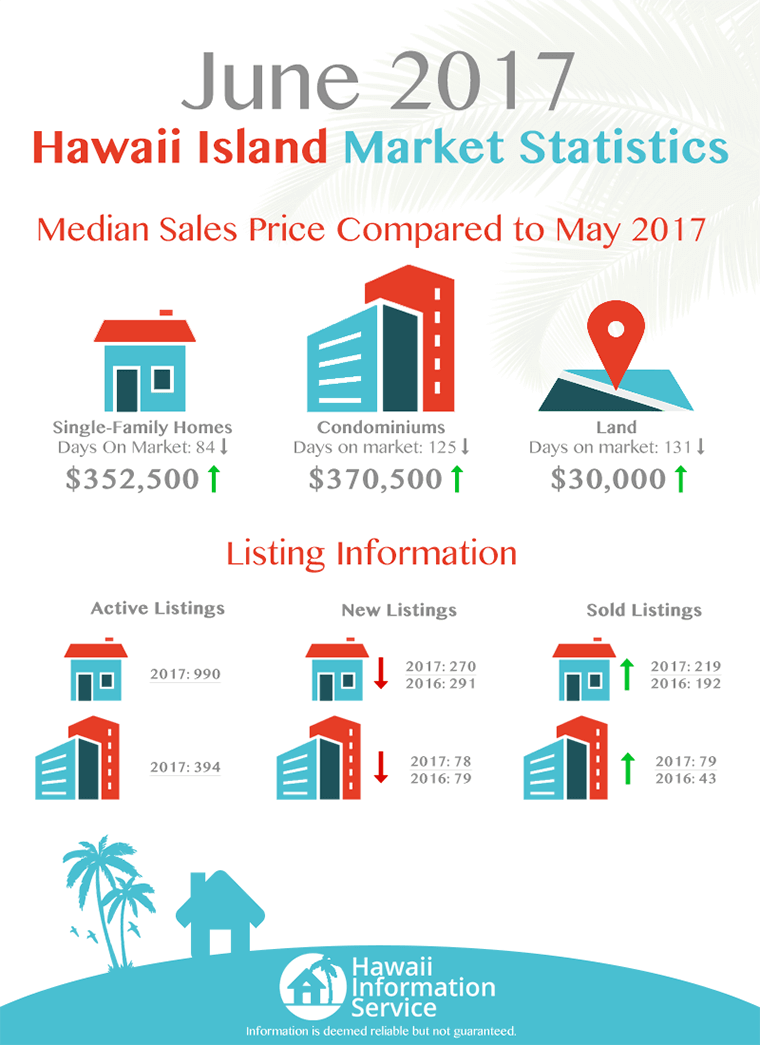
Title Guaranty Hawaii Island Housing Stats-June 2017
Title Guaranty Statewide Housing Stats-June 2017
Hawaii Information (MLS)
Hawaii Information (MLS) report indicate the following positive results for Hawaii Island real estate sales:
South Kohala Resort District Single Family Homes
-3.01% decrease in the total number of single family homes sold YTD 2017 vs. YTD 2016 in the South Kohala Resort District.
+15.51% Increase in median sales price of single family homes YTD 2017 vs. YTD 2016 South Kohala Resort District.
South Kohala Resort District Condominium Homes
+18.03% Increase in the total number of condominium homes sold YTD 2017 vs. YTD 2016 South Kohala Resort District.
+15.61% Increase in median sales price of condominium homes YTD 2017 vs. YTD 2016 South Kohala Resort District.
Hawaii Island Single Family Homes
+5.61% Increase in the total number of single family homes sold YTD 2017 vs. YTD 2016 Hawaii Island.
+6.32% Increase in median sales price of single family homes YTD 2017 vs. YTD 2016 Hawaii Island.
Hawaii Island Condominium Homes
+20.27% Increase in the total number of condominium homes sold YTD 2017 vs. YTD 2016 Hawaii Island.
+6.82% Increase in median sales price of condominium homes YTD 2017 vs. YTD 2016 Hawaii Island.
Important Links
Waikoloa Beach Resort
Q2 2017 Waikoloa Beach Resort-Sales
Q2 2017 Waikoloa Beach Resort-Listings
Mauna Lani Resort
Q2 2017 Mauna Lani Resort-Sales
Q2 2017 Mauna Lani Resort-Listings
Mauna Kea Resort
Q2 2017 Mauna Kea Resort-Sales
Q2 2017 Mauna Kea Resort-Listings
Hawaii Island
Q2 2017 Hawaii Island Sales Report-Stats
Aloha,
Rick Oliver (B)
RB-18823
Coldwell Banker Island Properties
808-960-7330
[email protected]
![]()
![]()
![]()
![]()
![]()